Web UI
Overview
The Bacalhau WebUI offers an intuitive graphical interface for monitoring and managing your Bacalhau deployment. This guide provides comprehensive instructions for setting up, configuring, and utilizing the WebUI.
Getting Started
Enabling the WebUI
The WebUI is disabled by default. To enable it:
bacalhau config set WebUI.Enabled=true
You need to restart your Bacalhau node after enabling the WebUI for changes to take effect.
Network Configuration
By default, the WebUI listens on 0.0.0.0:8438 (all network interfaces). You can customize this:
bacalhau config set WebUI.Listen=127.0.0.1:8438  # Local access only
# or
bacalhau config set WebUI.Listen=192.168.1.100:9000  # Custom IP and port
Security Considerations
When exposing the WebUI beyond localhost:
- Consider setting up a reverse proxy with TLS
- Implement proper network security controls
- Be aware that the WebUI does not currently have authentication
Accessing the WebUI
Once your Bacalhau node is running with the WebUI enabled, access it by opening a web browser and navigating to:
http://localhost:8438
Or use the IP address and port you configured.
Main Features
Dashboard
The Dashboard provides a quick overview of your Bacalhau deployment, including:
- System status
- Resource utilization
- Recent job statistics
- Active node count
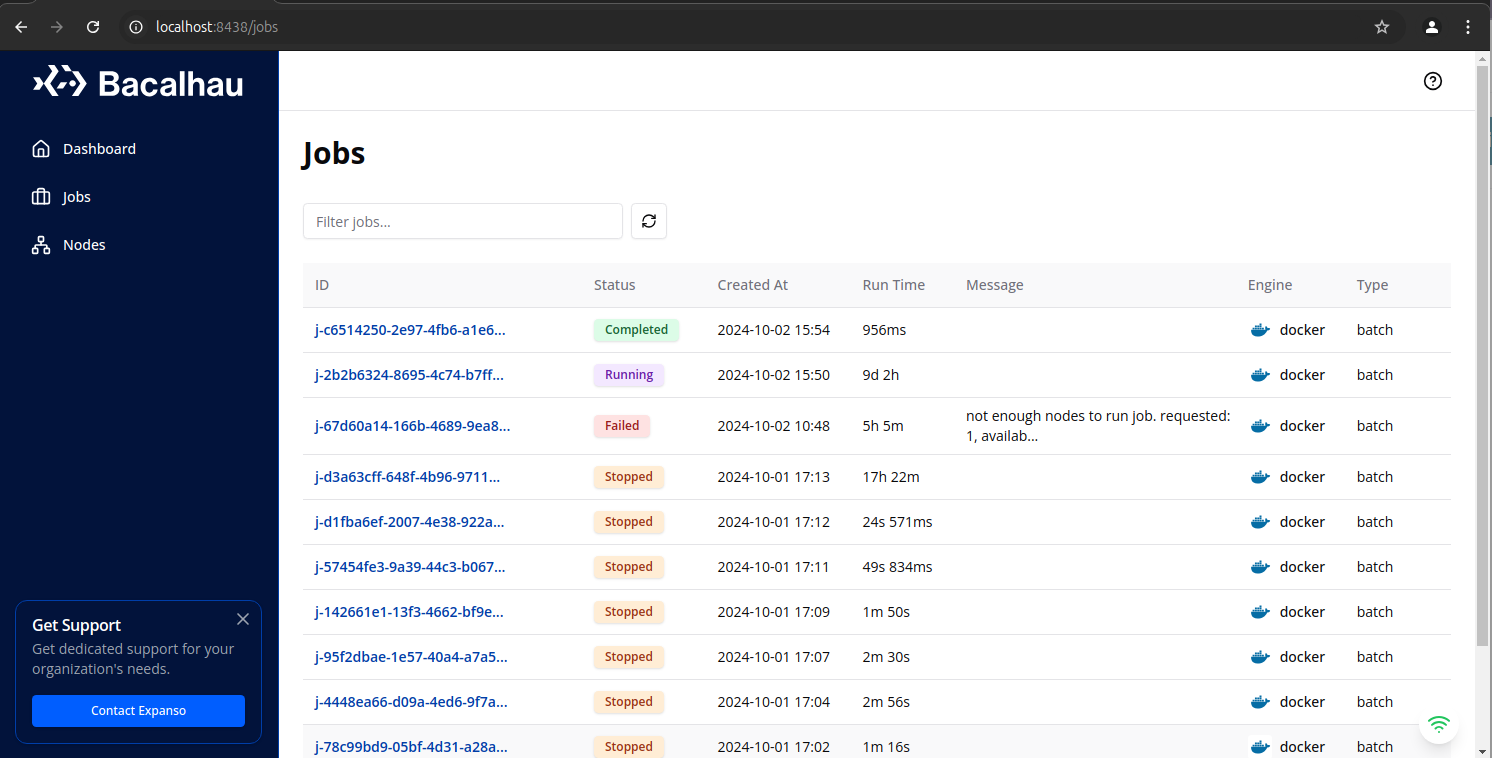
Jobs Management
The Jobs page allows you to:
- View all jobs with filtering and sorting options
- Monitor job status (Pending, Running, Completed, Failed)
- See job details including runtime, type, and error messages
- Access job-specific information and logs
Job Details
Click on any job ID to open the detailed view where you can:
- View the complete job history and event timeline
- See execution details across all nodes
- Access real-time logs for debugging
- Examine resource utilization
- View job specifications and parameters
Node Management
The Nodes page provides visibility into your cluster:
- View all nodes in your Bacalhau deployment
- See node type (Compute, Requester, or Both)
- Monitor membership and connection status
- View available and total resources per node
- See node labels for job targeting
Node Details
Click on any node ID to access:
- Detailed node status and health metrics
- Configuration settings
- Currently running and scheduled jobs
- Resource allocation and availability
- Connection history
Troubleshooting with the WebUI
The WebUI is a valuable tool for diagnosing issues:
- Check job logs for error messages
- Verify node availability and resource capacity
- Examine job constraints against available node labels
- Monitor resource utilization across the cluster
Integration with CLI
The WebUI complements the Bacalhau CLI:
- Use the CLI for job submission and automation
- Use the WebUI for monitoring and visual inspection
- Both tools access the same underlying API